
.jpg?width=800&height=607&name=55356319847_fb67620912_c%20(1).jpg)
Studying Moths in the Field
Moth biodiversity is explored here through regular night‑time surveys using a mix of actinic and LED light traps, each designed to gently attract and record the moths that move through our landscapes after dark. Every trapping session adds new species records to a growing year‑round dataset, helping us see how different habitats support different moth communities. By turning these lists into simple, accessible data analysis, we can highlight interesting ecological stories — from seasonal changes in abundance to the ways moths act as indicators of habitat quality and environmental change.
Why we moth trap
Moth trapping lets us see a part of the natural world that most people never notice. When the sun goes down, hundreds of species move quietly through our landscapes, each one linked to the plants, habitats, and seasonal rhythms around it. By running regular night‑time surveys, we build a picture of how these communities change through the year — which species are thriving, which are declining, and what that says about the places we care for. It’s a simple idea with a big impact: record what turns up, keep doing it consistently, and over time the patterns reveal real ecological stories.
How we moth trap
We use a mix of actinic and LED light traps, chosen because they’re reliable, energy‑efficient, and gentle on the moths themselves. Each trap creates a small pool of light that attracts passing moths, allowing us to record them before releasing them unharmed. The traps are placed in different habitats — woodland edges, meadow margins, wetland fringes — so we can compare how each area supports its own community. After dawn, we work through the catch: identifying species, noting abundance, and adding everything to a growing dataset. It’s a straightforward method, but when repeated across sites and seasons, it becomes a powerful way to understand biodiversity.
What We Do With the Data
Once the species lists are entered, the real insight begins. We look at how abundance changes through the year, which habitats support the highest diversity, and how seasonal peaks line up with vegetation growth or weather patterns. Recent data work for 2026— like our Brackagh Moss analysis — shows how useful this can be. For example, we've already spotted early‑season spikes in micros, late‑summer dominance by a few strong fliers, and clear differences between woodland‑edge and open‑fen traps. By comparing nightly totals, flight periods, and habitat‑specific assemblages, we can highlight ecological facts that aren’t obvious from a single night’s catch. Over time, these patterns help us understand habitat quality, restoration progress, and the wider conservation value of the landscapes we survey.
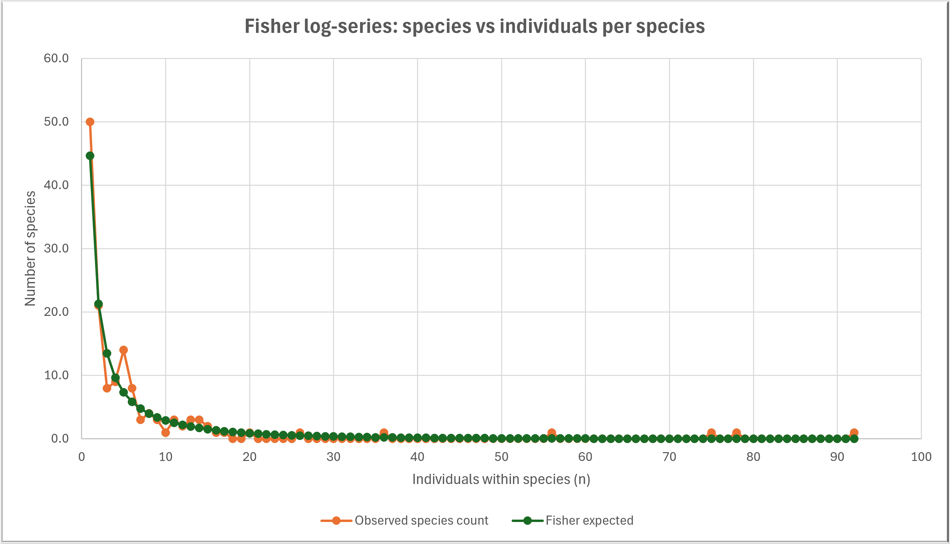
One example of this is the Fisher log-series curve. Fisher’s log‑series is a simple mathematical model that helps us understand how moth species are distributed in a community. It’s based on a pattern ecologists see again and again: most species are rare, and only a few are common. The model turns this pattern into a curve that shows how many species you’d expect at each abundance level — singletons, occasional species, and the handful of regulars that appear in most traps. Here is the Fisher Curve for the Brackagh Bog from 1st Jan - 15th June 2026:
Moth Trap Data and Lists
Explore detailed moth-trapping records, careful analysis, and highlights of the most notable catches. Each trap list will include the high and low temperatures recorded on the evening of capture, together with the light used. These details help build a clearer picture of moth activity and show how changing conditions influence the species found at the various trap sites.
- Brackagh Moss April/June 2026
- Brackagh Moss 6th June 2026
- Mid-year Data analysis for Brackagh Moss 2026